“Our over-reliance on gas has left us vulnerable, and while we’ve squandered our valuable gas resources, hope is not lost. By leveraging our vast lignite coal reserves, we can ensure energy security and economic stability for Pakistan also information about Comparative Analysis of Energy Mix in Pakistan – This article sheds light on how to salvage ourselves.”
Introduction
First and foremost, this article is not an attempt at political point scoring; hindsight is invariably supposed to be 20/20 anyway. Instead, this post aims to create a dialogue around this topic by breaking down key points in a more positive light. It will also provide insights into the principal statistics regarding annual energy consumption until June 2024, in Pakistan, India, China, and the U.S. according to their specific shares. It particularly focuses on coal’s role in global annual energy consumption and how it can be better utilized in Pakistan to provide an ultimate solution for energy security. Hamza Consultant Provides you with a Comparative Analysis of the Energy Mix in Pakistan in just one click.
Currently, Pakistan generates around 80% of its electricity from crude oil, 11% from hydroelectric, 6% from coal, 1% from LPG, and 2% from nuclear energy. Pakistan is considerably behind in refining, hence it relies on petroleum imports.
Pakistan is currently at a critical stage in its energy history as it seeks to increase its energy reserves to meet growing power needs. Despite having around 200 billion metric tons of low-cost lignite coal resources, Pakistan’s energy mix remains heavily dependent on gas, which accounts for nearly half of its total consumption. This dependency has created inefficiencies and vulnerabilities in the energy supply chain.
The Sui gas field, developed in 1952, proved to be a giant with 13 trillion cubic feet (TCF) of reserves. Initially a great boon, this abundant and cheap gas led to over-reliance, with more than 90 percent of the industry becoming dependent on it. Early planners assumed the gas would never run out, investing in alternative energies only when necessary. By 2000, this strategy became unprofitable. The transportation sector also heavily used gas for fuel, peaking at 370 million cubic feet per day (MMscfd) in 2010-11. Technocrats now question whether using compressed natural gas (CNG) was wise, as it has led to an energy crisis when gas reserves are depleted.
India, in contrast, did not find as much gas as Pakistan. It discovered its first big gas field, Dhirubhai, in 2002, 50 years after Sui, with 10 TCF. This delay forced India to rely primarily on coal, which still occupies 55% of its energy supply. India consumes eight times more coal than Pakistan, showing better energy management. Similarly, China and the USA have historically relied on coal, though the US has seen a shift due to shale gas production.
Technological improvements in coal-fired power plants, especially using lignite, offer solutions to Pakistan’s energy problems. Modern lignite-fired plants developed by China could help Pakistan use its abundant lignite resources, saving billions on imports and enhancing energy security. This requires a strategic shift from gas to coal.
Currently, Pakistan’s annual energy consumption from coal is 12,740 GWh, while its power demand exceeds 130 million MWh per annum. In comparison, India’s annual consumption is 1.5 billion MWh, with coal accounting for 825 million GWh. China’s annual energy use is 6 billion MWh, with 3,420,000 GWh from coal, and the U.S. uses 4 billion MWh annually, with 440,000 GWh from coal.
These figures highlight the significant role coal plays in the energy plans of these countries compared to Pakistan. They underscore the need for Pakistan to tap into its vast coal resources to improve its energy mix and ensure economic stability.
Pakistan Total Electricity Consumption in MW 2024
Pakistan’s total power usage in 2024 was 68,559 GWh. This compares to a total electricity generation of 92,091 GWh for the same time period.
Energy Mix of Pakistan vs India, China (2024) and USA (2010 & 2024)
Pakistan
The following Pie Diagram shows Pakistan’s current energy mix as of June 2024 and also provides textual information on the total annual energy consumption and the specific contribution from coal.
According to the chart, Pakistan’s energy mix is composed of the following sources:

-
- Gas: 46.5%
-
- Oil: 31.2%
-
- Coal: 9.8%
-
- Hydro: 9.7%
-
- Nuclear: 2.4%
-
- Renewable: 0.4%
From the energy mix, we can observe that gas is the largest source of energy, accounting for almost half of the total mix at 46.5%. The use of coal, while not as significant as gas, still makes up a notable 9.8% of the energy mix.
The accompanying text states that Pakistan’s total annual energy consumption is 130,000,000 MWh (megawatt-hours) and that the contribution from coal is 12,740 GWh, which is a significant contribution to the country’s total energy consumption.
In summary, the image emphasizes the heavy reliance on gas in Pakistan’s energy mix, with coal also playing a significant role. The country’s total energy consumption is quite high, and coal contributes a considerable portion to this consumption, which could potentially be increased given Pakistan’s large coal reserves.
The image shows a pie chart detailing India’s current energy mix as of June 2024 and includes information on the total annual energy consumption and the contribution from coal.
India’s energy mix is distributed as follows:
-
- Coal: 55%
-
- Oil: 30%
-
- Gas: 7%
-
- Hydro: 5%
-
- Nuclear: 1%
-
- Renewable: 2%
Coal is the predominant source of energy, constituting more than half of the energy mix at 55%. In comparison, gas contributes a much smaller 7% to the overall energy mix.
The textual information on the right side of the pie chart states that India’s total annual energy consumption is 1,500,000,000 MWh (megawatt-hours), and the contribution from coal is 825,000 GWh. As such, 825,000 GWh would be equivalent to 825 TWh. This suggests a significant reliance on coal for India’s energy needs.
In summary, the image emphasizes India’s heavy reliance on coal within its energy mix, with coal being the largest single source by a substantial margin compared to gas and other energy sources. The total annual energy consumption for India is extremely high, and coal’s contribution to this consumption is considerable.
India
The Pie Diagram shows India’s current energy mix as of June 2024. It also includes information on the total annual energy consumption and the contribution of coal.

Here are the specifics of China’s energy mix:
-
- Coal: 57%
-
- Oil: 20%
-
- Gas: 8%
-
- Hydro: 8%
-
- Nuclear: 2%
-
- Renewable: 5%
China
Coal is the largest component of China’s energy mix, making up 57% of the total, indicating a heavy reliance on coal for energy. Gas, on the other hand, accounts for a much smaller share at 8%.
China’s total annual energy consumption is 6,000,000,000 MWh (megawatt-hours), and the contribution from coal is 3,420,000 GWh. As such, 3,420,000 GWh would translate to 3,420 TWh, showcasing the significant role coal plays in China’s energy consumption.

In summary, the image demonstrates that China’s energy mix is heavily dominated by coal, with gas playing a much smaller role. The total energy consumption for the country is vast, and coal’s contribution is substantial, reflecting China’s status as one of the world’s largest consumers and producers of coal for energy.
1. USA (2024)
United States’ current energy generation mix as of June 2024 is depicted in the following Pie Diagram along with its figure for total annual energy consumption, and coal’s percentage of it. Combining economies of scale with improvements in the technology for extracting gas and oil from shale, has resulted in a radically altered energy scene in the USA. Shale gas/oil is now more commercially viable with the use of horizontal drilling, hydraulic fracturing, and other completion techniques for production from individual well completions. It is precisely this technological advance that has helped dramatically expand the yield of shale gas, overtaking coal in its contribution to the energy mix.
The summary of the respective energy mix is illustrated in the attached chart for the USA in June 2024, and is as depicted as follows:
-
- Coal: 11%
-
- Oil: 36%
-
- Gas: 34%
-
- Hydro: 7%
-
- Nuclear: 9%
-
- Renewable: 3%
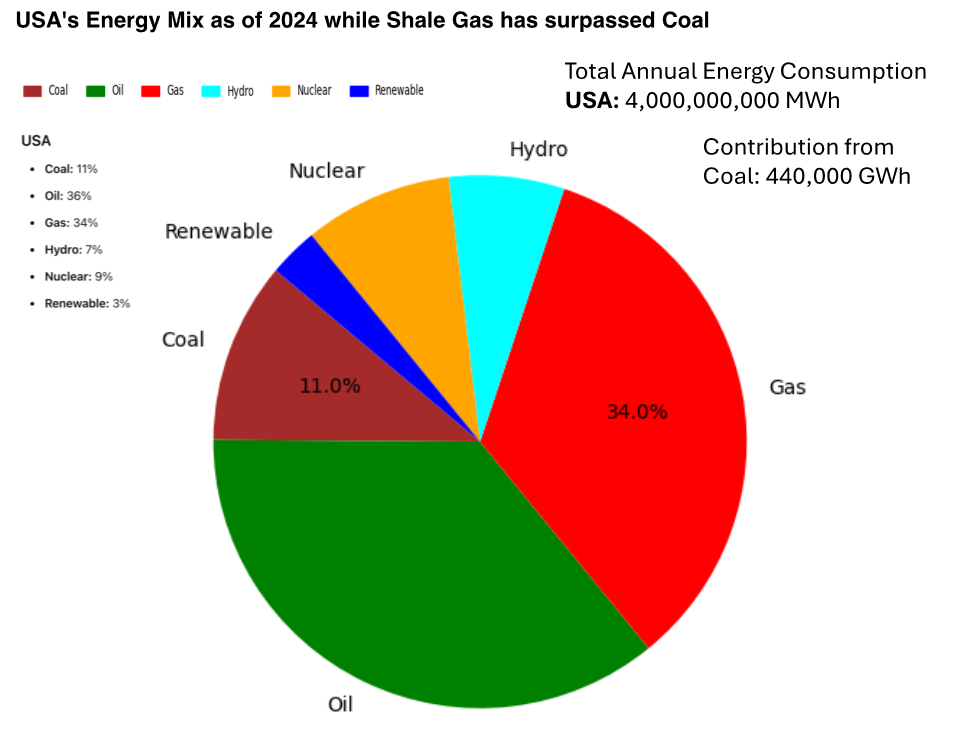
Gas constitutes a much bigger slice of the USA’s energy pie than coal as you can see on the chart (11% for coal vs 34% for gas). The largest source of energy supply is oil, which (at 36%) was ahead of natural gas with a share of 24% and coal with 20%. This pie chart tells us that the US annual energy consumption is 4,000,000,000 MWh (megawatt hours). It also states an amount of 440,000 GWh from coal (24% of what it was in 2010), so 440,000 GWh would be converted to 440 TWh and by this number, we conclude that coal supply plays a significant but not the main role in the overall energy consumption.
To summarize, the image shows that – as a share in the energy mix of the USA – the most important sources are gas and oil, the latter being only slightly less important, and that coal plays a much smaller role. However, coal remains a major part of the country’s energy mix.
2. USA (2010)
The USA Energy Mix in 2010 (as shown in the image below) indicates the energy mix of the United States in the year 2010, a time noted for the beginning of shale gas/oil significantly impacting the energy consumption market in the U.S. It also includes figures for the total annual energy consumption and the contribution from coal.
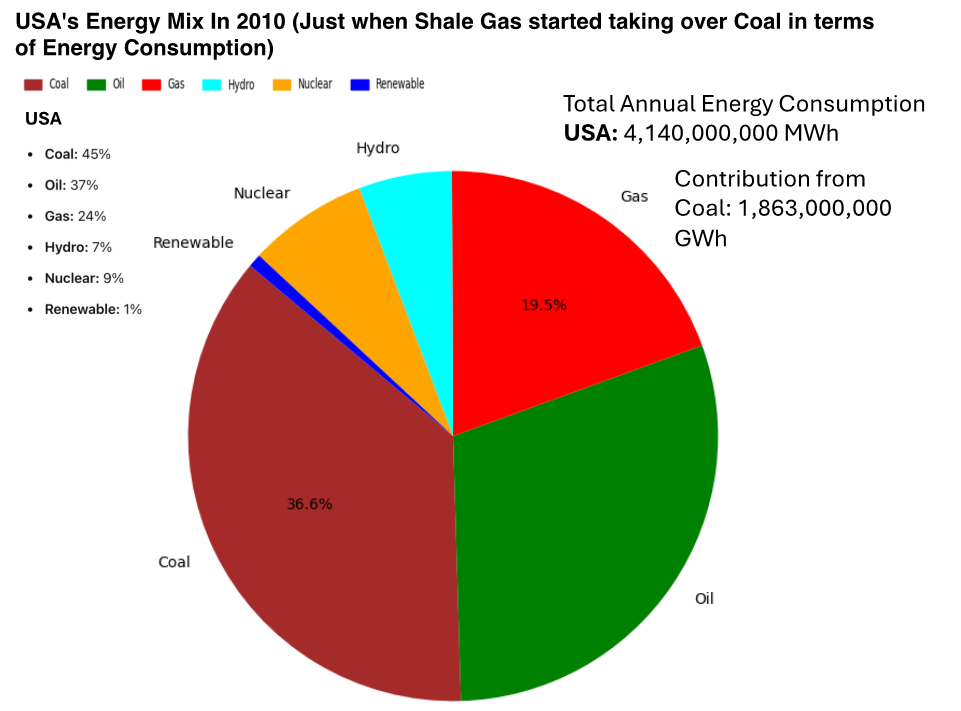
Here’s the breakdown of the U.S. energy mix in 2010:
-
- Coal: 45%
-
- Oil: 37%
-
- Gas: 24%
-
- Hydro: 7%
-
- Nuclear: 9%
-
- Renewable: 1%
In 2010, coal was a major part of the U.S. energy mix, constituting 45% of the total. Gas accounted for a smaller, yet substantial, 24%. The chart indicates that at this point, coal was a more dominant source of energy than gas.
The additional text states that the total annual energy consumption of the USA was 4,140,000,000 MWh (megawatt-hours), and the contribution from coal was 1,863,000 GWh. This figure would convert to 1,863 TWh (terawatt-hours), suggesting that coal contributed significantly to the U.S. energy consumption during that year.
In summary, the image illustrates that in 2010, the U.S. relied heavily on coal, with it being the largest single contributor to the energy mix, followed by oil and gas. The emergence of shale gas had started to shift the energy landscape, but coal was still a predominant source of energy at that time.
Lignite as a Major Potential Source of Power Generation in Pakistan: Past, Present, and Future – Global/China
Introduction
Lignite, often referred to as brown coal, is a low-rank, lower-grade type of coal that contains high moisture content and volatility. These characteristics have historically caused significant technical and environmental challenges, leading to a milder push for its use in power generation and also related to Harmonizing Creation and Evolution. However, advancements in modern technology and strategic development efforts, particularly by countries like China, have transformed lignite into a feasible and large-scale power source.
This essay presents the historical context of lignite utilization, examining how technological advancements have made its current use practical. Finally, it discusses the potential impact of lignite on Pakistan’s energy landscape.
Historical Perspective
Lignite has historically been considered a “dirty” fuel for power generation, often overlooked due to its high moisture content – up to 60% – making it heavy, difficult to transport, and inefficient. Its high volatility posed significant risks and contributed to environmental concerns, leading to a focus on higher-grade coals, oil, and gas for power generation.
Technological Advancements
Advancements in technology have begun to change this perception. Modern upgrades, such as fluidized bed combustion (FBC) and Integrated Gasification Combined Cycle (IGCC), have significantly improved the efficiency and environmental performance of lignite-fired power plants.
-
- Fluidized Bed Combustion (FBC): This technology enables combustion at lower temperatures, resulting in lower nitrogen oxide emissions and better control of sulfur emissions. It also allows for the effective burning of very low-rank coal, making it ideal for lignite.
-
- Integrated Gasification Combined Cycle (IGCC): This process converts lignite into syngas, which can be combusted in gas turbines for electricity generation. This significantly reduces the environmental impact compared to traditional coal burning.
China’s Influence on Lignite Utilisation
China has become a leader in integrating lignite for power generation. With vast lignite reserves, China has invested heavily in building modern lignite-fired power plants. These plants demonstrate that new technologies can surpass conventional limits. China has also invested in research and development, importing specialist technology to dry lignite before burning, which lowers its moisture content and increases its calorific value. Strict environmental regulations in China now require the use of advanced emission control technologies in lignite-fired plants.
Lignite Reserves in Pakistan
Pakistan is endowed with the seventh largest lignite reserves in the world, estimated at around 200 billion metric tons in the Thar region. These reserves represent a significant untapped resource that could play a decisive role in Pakistan’s energy transformation.
Potential Impact on Pakistan’s Energy Landscape
Utilizing lignite for power generation can significantly reduce Pakistan’s dependence on imported oil and gas. Developing lignite-fired power plants would boost the economy, create employment opportunities, and promote local development, particularly in the Tharparkar region.
Managing Environmental Concerns
Lignite’s high moisture and volatility present environmental challenges, such as high CO2 and SO2 emissions. Fly ash from lignite combustion contains heavy metals that can contaminate soil and water. However, several emission control technologies, including electrostatic precipitators, flue gas desulphurization, and selective catalytic reduction, can mitigate these pollutants.
Examples of Environmental Management
-
- Emission Control Technologies: Implementing these technologies can significantly reduce pollutants from lignite-fired power plants.
-
- Supplemental Lignite Drying Technologies: Pre-drying lignite before combustion reduces moisture levels, increases calorific value, and improves energy conversion efficiency while lowering emissions.
-
- Waste Management: Proper disposal and recycling of coal ash and other byproducts are essential to prevent further environmental contamination.
The transformation of lignite from an undesirable fuel to a viable energy source illustrates the potential of technological advancements. Harnessing Pakistan’s abundant lignite reserves with the best available technologies could transform the country’s energy landscape. However, stringent regulations and the implementation of clean emission technologies are essential to address the environmental challenges associated with lignite. This strategy will ensure energy security, reduce dependence on imported fuels, and promote sustainable development in Pakistan.
Pakistan’s Population and Carbon Emission vs India, China and USA viz Corresponding Population
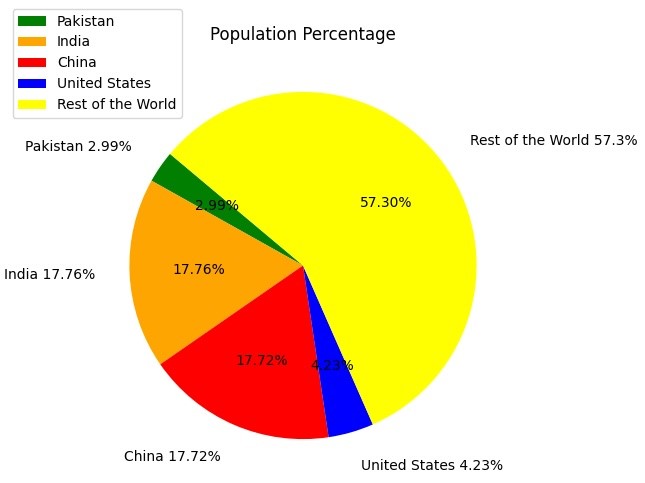
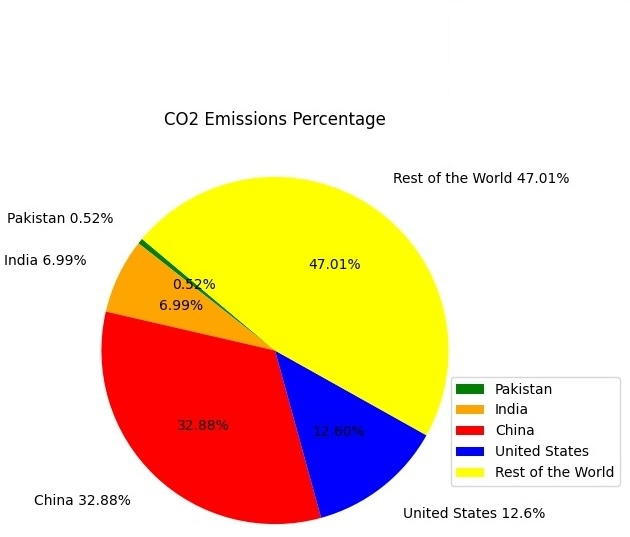
Pie Charts for Population and CO2 Emissions by Country (Pakistan, India, China, USA, and the rest of the world are given below):
| Country | Percentage in World’s Population | Country | Percentage of CO2 Emission in 2022* |
| Pakistan | 2.99% | Pakistan | 0.52% |
| India | 17.76% | India | 6.99% |
| China | 17.72% | China | 32.88% |
| United States | 4.23% | United States | 12.6% |
2024 World Population Review
The two pie charts illustrate the share of the world population and CO2 emissions by countries/regions. The charts show:
Population Percentage:
-
- Pakistan: 2.99%
-
- India: 17.76%
-
- China: 17.72%
-
- United States: 4.23%
-
- Rest of the World: 57.30%
CO2 Emissions Percentage:
-
- Pakistan: 0.52%
-
- India: 6.99%
-
- China: 32.88%
-
- United States: 12.60%
-
- Rest of the World: 47.01%
Paris Agreement and Coal Divestment
We signed the Paris Agreement (PA) on 12th December 2015, committing to move away from coal, contrary to some misrepresentations.
The Paris Agreement aims to reduce global warming and limit greenhouse gas emissions, including specific clauses addressing coal use.
Coal Divestment: Countries that signed the Paris Agreement can expect increased divestment from fossil fuels and coal. Investors, anticipating strong carbon abatement policies, often sell their shares in the coal power sector, expecting its decline. Even without explicit climate policies, these divestments can reduce emissions by 5%-20%.
Global Phase-Out Requirements: The Paris Agreement calls for an 80% reduction in global coal use for power by 2030, compared to 2015 levels. This includes a commitment by OECD nations to phase out coal completely by 2030 and to close all remaining unabated hard-coal-fired power stations by 2040. This means Pakistan is prohibited from building new coal-fired power plants after December 2030, despite our relatively low CO2 emissions per capita.
For perspective, Pakistan’s CO2 emissions per capita were just 1.05 tonnes in 2022, with a minimal impact of 0.52% of global emissions. In contrast, countries like the USA and China have significantly higher carbon footprints. Additionally, building a lignite-fired power plant costs between $2 billion and $5 billion, a sum that is unlikely to be raised within the next six years, especially for multiple plants.
Impact of Carbon Pricing: Coal is highly sensitive to carbon pricing. A carbon price of $20 per ton of CO2 effectively doubles the cost of coal, redirecting investments towards low-carbon energy sources. Consequently, coal power plants become less attractive investments.
In summary, the Paris Agreement and associated policies are driving a global shift away from coal. For Pakistan, this means a need to focus on alternative energy sources and innovative solutions to meet future energy demands while adhering to international commitments.
Analysis of Population Percentage to CO2 Emissions vis-a-vis Paris Agreement – Way Forward For Pakistan
United States: US citizens make up 4.23% of the global population but are responsible for 12.60% of CO2 emissions, implying that per capita emission rates in this country are very high.
China: China has 17.72% of the world’s population but contributes to 32.88% of CO2 emissions, indicating a high emission level relative to its population size.
Pakistan: Pakistan contributes only 0.52% of CO2 emissions compared to its 2.99% share of the global population, suggesting a lower per capita emission rate.
Using lignite-fired power plants, as indicated by all of Pakistan’s major coal companies last December when the projects were announced for financial completion, may be beneficial given Pakistan’s less-than-one-tenth-percentage-point share of global emissions per capita. The Paris Agreement aims to control the rise of global surface temperatures, which means reducing CO2 emissions. This agreement might restrict Pakistan from installing additional coal-fired power plants to address the country’s severe energy problems, despite its large lignite reserves (seventh in the world).
With Pakistan facing some of the worst energy-related challenges in the world and possessing the seventh largest lignite coal reserves on earth, it would make sense for Islamabad, being a signatory to the Paris Agreement in December 2015, to renegotiate or at least re-engage with its apex body, the United Nations Framework Convention on Climate Change (UNFCCC). Pakistan should seek responsible coal mining coal and coal firing practices and request a waiver to be assessed in 2024, allowing for the deferment of the construction of new coal-fired power plants until around 2040. This 15-year breathing space is critical for Pakistan to prevent its massive lignite assets from being rendered unusable yet falling prey to the Paris Agreement. Highlighting the advancements in lignite-fired power generation technology, which has improved environmental compatibility, can support the extension efforts by showing it will not cause significant global climate damage. While leveraging CO2 Emission per capita cushion, Pakistan can still demonstrate its commitment by designing these future coal-fired plants in the best environment-friendly way.
It is important to note that Pakistan heavily relies on gas power generation and green energy anyway, unlike its neighbors India and China, which promote coal-fired power to the tune of around 50% of their energy mix, Coal makes less than 10% of the energy mix. India produces six times more electricity from coal alone than the total energy consumption in Pakistan. This move to alternative energy sources demonstrates that Pakistan’s environmental footprint is less detrimental, providing a strong argument for more lenient timelines. Armed with these developments and comparisons, Pakistan might be able to advocate for using its lignite reserves (seventh largest in the world) without undermining its ambitions of transitioning towards a cleaner energy future.
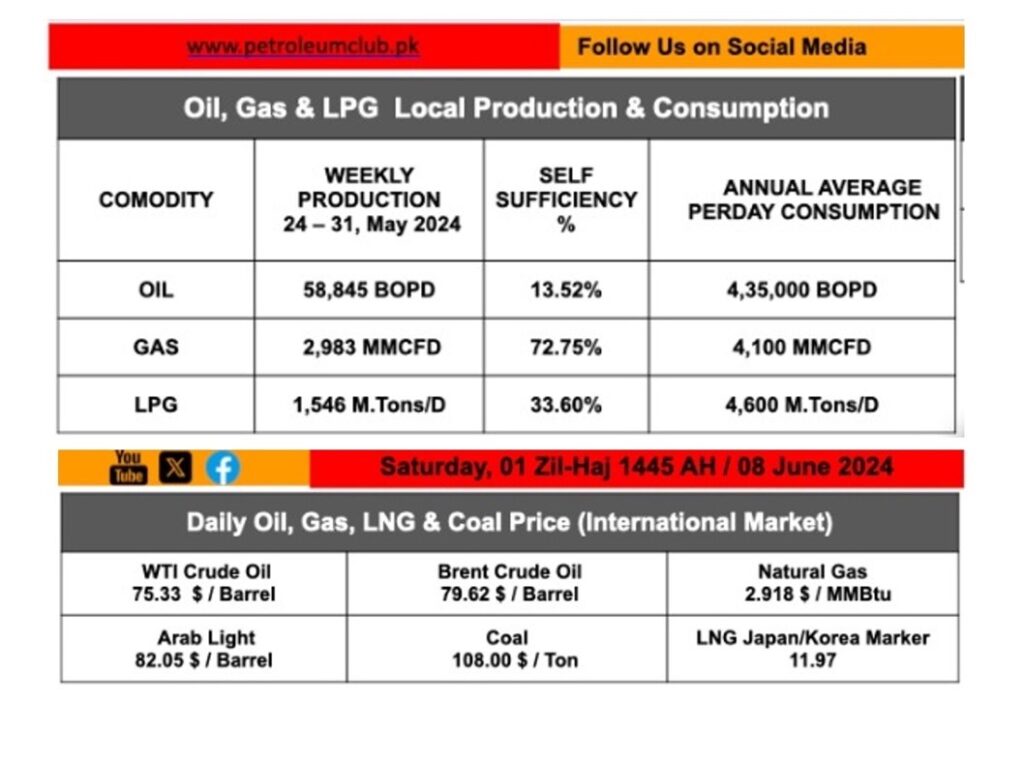
Pakistan’s Oil & Gas Production vs. Consumption (Thanks to PCP)
-
- Oil:
-
- Weekly Production: 58,845 BOPD (barrels of oil per day)
-
- Self-Sufficiency: 13.52%
-
- Annual Average Per Day Consumption: 435,000 BOPD
-
- Oil:
-
- Gas:
-
- Weekly Production: 2,983 MMCFD (million cubic feet per day)
-
- Self-Sufficiency: 72.75%
-
- Annual Average Per Day Consumption: 4,100 MMCFD
-
- Gas:
-
- LPG:
-
- Weekly Production: 1,546 metric tons per day
-
- Self-Sufficiency: 33.60%
-
- Annual Average Per Day Consumption: 4,600 metric tons per day
-
- LPG:
Current International Market Prices
-
- WTI Crude Oil: $75.33 per barrel
-
- Brent Crude Oil: $79.62 per barrel
-
- Arab Light: $82.05 per barrel
-
- Natural Gas: $2.918 per MMBtu
-
- LNG Japan/Korea Marker: $11.97 per MMBtu
-
- Coal: $108.00 per ton
Pakistan produces hardly any of these commodities and needs to import them in large quantities, which puts pressure on our foreign exchange reserves. Gas is king, covering almost 73% of domestic demand, and it has a clear focus on the energy mix. Meanwhile, oil and LPG production cover considerably less of the demand (13.52% for oil; and 33.60% respectively).
As shown in the above images, Pakistan only produces 12,740 GWh of electricity from coal, which is very minor compared to the amount generated by India using coal. With large coal reserves in Pakistan that have not been exploited so far, burning more coal could also be an option to reduce expensive fuel imports of oil and gas for electricity.
Given that Australia has abundant coal, the energy mix today can be seen as underusing coal for electricity production. The use of these reserves can not only lower the import bill but also create a balanced mix in energy production, which would eventually have to include renewable sources as well. Nonetheless, any strategic decisions in this area must be made with consideration of the environmental consequences, as well as having an affordable and deployable financial and technological framework for realizing this coal resource.
Historical Oil Price of West Texas Intermediate Crude Oil (US$/Barrel)
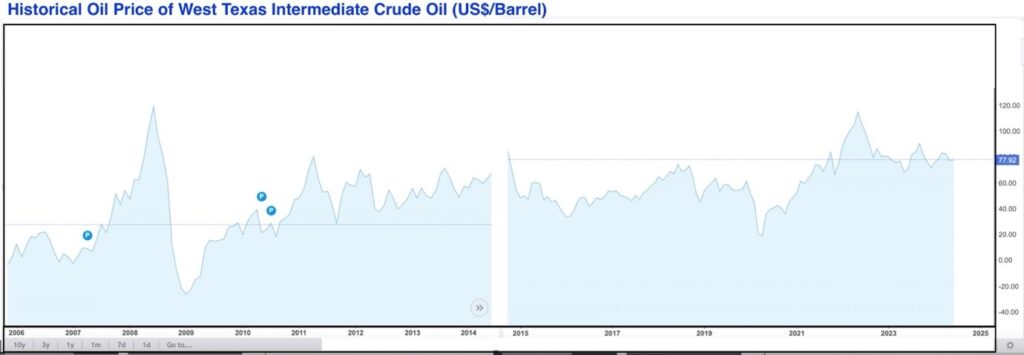
The West Texas Intermediate (WTI) Crude Oil chart is the most widely followed indicator of global petroleum pricing and is a useful tool for traders, investors, and analysts seeking to understand price dynamics in energy markets around the world.
A Descriptive Account of Price Movements
-
- 2006: WTI crude oil prices began rising, experiencing exponential gains up to the global financial crisis.
-
- 2008-2009: After hitting its highest level in nearly five years, oil prices plummeted as the global financial crisis hit and oil demand slumped.
-
- 2009-2014: Prices recovered and stabilized after the worst of 2009. Prices fluctuated but remained within a tight range, with occasional peaks.
-
- 2014-2016: A rapid price drop occurred due to an oil glut, partly because of a surge in US shale production and OPEC’s decision not to cut output.
-
- 2016-2020: Prices slowly increased after dipping in 2016, followed by volatility due to geopolitical tensions, production levels, and economic policies.
-
- 2020-2021: There was a sharp drop in prices in 2020 due to the COVID-19 pandemic, which caused a significant decrease in oil demand.
-
- 2021-Present: Prices began to rebound as the global economy reopened, travel resumed, and supply and demand in oil markets balanced.
The last point of the chart highlights that WTI crude oil price is approximately $77.92 per barrel, a considerable improvement from 2020 lows but still below prices in prior years.
Current Price of Various Petroleum Products in Pakistan
The table illustrated below (thanks to PCP) gives a view of prices in their home currency for different petroleum products, CNG (Compressed Natural Gas), and coal along with exchange rates between the US dollar ($) and Pakistani rupee (Rs).
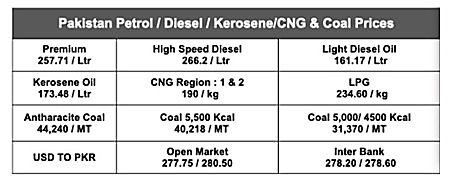
Here are the prices listed in the image:
-
- Premium (Petrol): 257.71 PKR per litre
-
- High-Speed Diesel: 266.2 PKR per litre
-
- Light Diesel Oil: 161.17 PKR per liter
-
- Kerosene Oil: 173.48 PKR per litre
-
- CNG (Region 1 & 2): 190 PKR per kg
-
- LPG: 234.60 PKR per kg
-
- Anthracite Coal: 44,240 PKR per metric ton
-
- Coal (5,500 Kcal): 40,218 PKR per metric ton
-
- Coal (5,000/4,500 Kcal): 31,370 PKR per metric ton
-
- USD to PKR Exchange Rates: Open Market (277.75/280.50), Inter Bank (278.20/278.60)
To provide a ballpark effect of government levies on these refined products vis-à-vis existing crude oil and other prices provided in the previous image:
-
- Crude Oil Prices (From Previous Image):
-
- WTI Crude Oil: $75.33 per barrel
-
- Brent Crude Oil: $79.62 per barrel
-
- Arab Light: $82.05 per barrel
The cost of imported crude oil in PKR can be calculated when compared with the retail price of refined products based on prices of Crude Oil & Exchange rates. In practice, the difference between the price of crude oil and that of petroleum products will include refining costs, distribution costs, company margin (profit), competitive aspects, and not at least levies like taxes or duties to finance public services.
-
- Government Levies
Although not stated in the image, government duties include fixed as well as percentage-based taxes (such as VAT where it applies), customs duty,y, and other charges – these are added to the base fuel price. These taxes can alter the final retail price that consumers pay quite drastically.
-
- Refined Products vs. Crude Prices:
The refined product prices petrol and diesel price are higher when converted to PKR per liter compared with the crude oil prices. For instance, WTI Crude Oil at $75.33 per barrel (~159 liters), if we calculate its base price/liter: ~$0.47 becomes about 130.66 PKR (avg rate of exchange @278/PKR/USD) A significantly lower price than the prices at which petrol and diesel are retailed suggests an absence of refining, distribution costs or taxes collected by both regional (state) governments.
-
- Coal Prices:
Coal prices are provided in PKR/MT. Pakistan has immense coal deposits, so the domestic charges for this raw material should reflect mining fees and fixed prices that include transportation costs, as well as taxes or subsidies provided by the government. The displayed prices for coal amount to something per energy unit compared to oil and gas, but it could delay cost savings integration of coal in the energy system supply chain.
In summary, government taxes on the production of refined oil products in Pakistan also add to the retail price above base crude prices. No specific figures on taxes and duties have been given, but the spread between international crude prices and locally traded retail prices indicates that these levies are significant to Field Development. A way to save foreign exchange reserves is by increasing the use of coal as a source of energy, which would mean less money spent on imports and more savings, provided environmental concerns can be addressed.
Conclusion
Coal has the potential to dramatically change Pakistan’s energy equation, making it a viable alternative to importing oil and gas. With its abundant lignite reserves, Pakistan could use this resource to ensure energy security and reduce its power import bill. India, China, and the USA provide clear examples of how coal plays a key role in meeting their energy needs. Pakistan can learn from its experiences and apply similar strategies to optimize its energy mix.
Currently, Pakistan’s energy mix is heavily skewed towards gas, making up almost half of the total energy consumption. This reliance on gas has led to inefficiencies and increased vulnerability due to the underutilization of coal. By incorporating a higher percentage of coal into its energy mix, Pakistan can achieve a more diversified energy portfolio, leading to a more stable energy security policy. This can help reduce dependency on a single energy source and mitigate the associated risks.
Despite being home to the world’s second-largest lignite coal deposits, Pakistan’s lignite resources remain largely unexploited for power generation. In contrast, countries like India, China, and the USA have harnessed their coal reserves to drive economic growth and meet energy demands. By adopting state-of-the-art coal technologies and following their lead, Pakistan can tap into its lignite resources and significantly improve its energy landscape.
The energy supply has been further disrupted by the major wastage of gas reserves in Pakistan, particularly through its use in the transportation sector as CNG. There has been little effort to replenish these gas stocks, with gas still being the primary energy source in the country’s mix. Pakistan needs to adopt the energy management practices of India, China, and the USA to develop a more sustainable and diversified energy policy, ensuring long-term security and stability.
In conclusion, a strategic shift towards coal, supported by technological advancements and lessons learned from other coal-dependent nations, can transform Pakistan’s energy sector. By leveraging its significant lignite reserves, Pakistan can reduce its reliance on imports, enhance energy security, and drive sustainable economic growth.
Humby penned by Moin Raza Khan
June 2024
Appendix-1
Pakistan’s CNG Usage in the Transport Sector peaked in 2011-12

Appendix-2
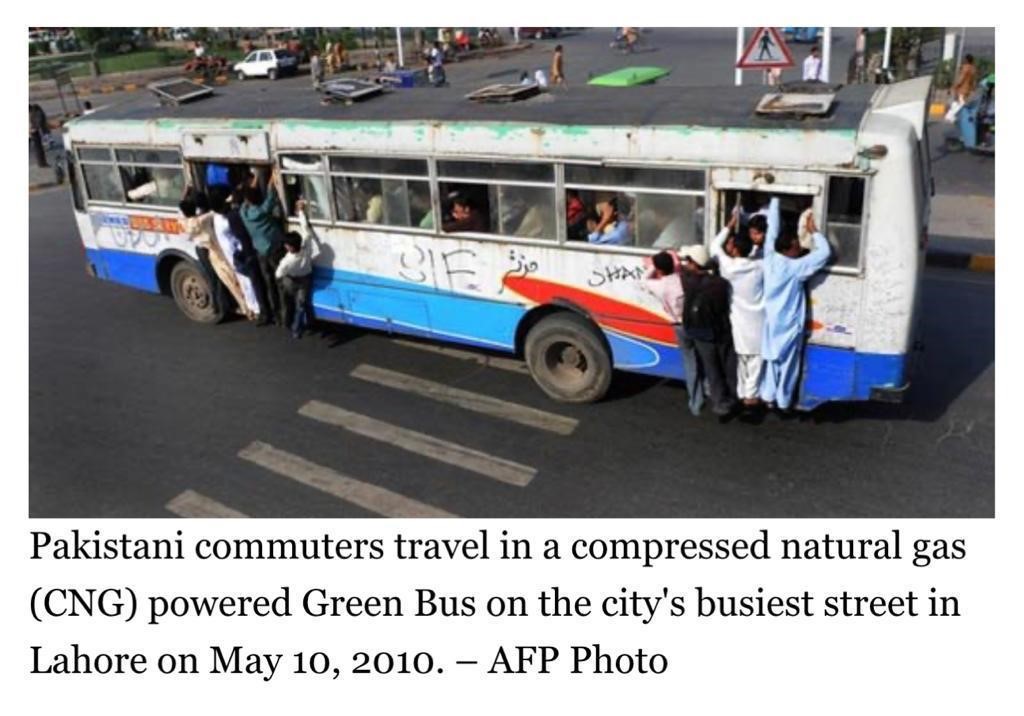
Appendix 2 is a mind-boggling, striking photograph from 2011 photo files. In hindsight, at that time, Pakistan was the largest CNG user country in the world. This is how our most precious resource was used. It’s the worst example of double dipping. First, this ever-depleting natural gas is an energy source itself, and second, we use electricity to compress it into CNG.
Appendix-3
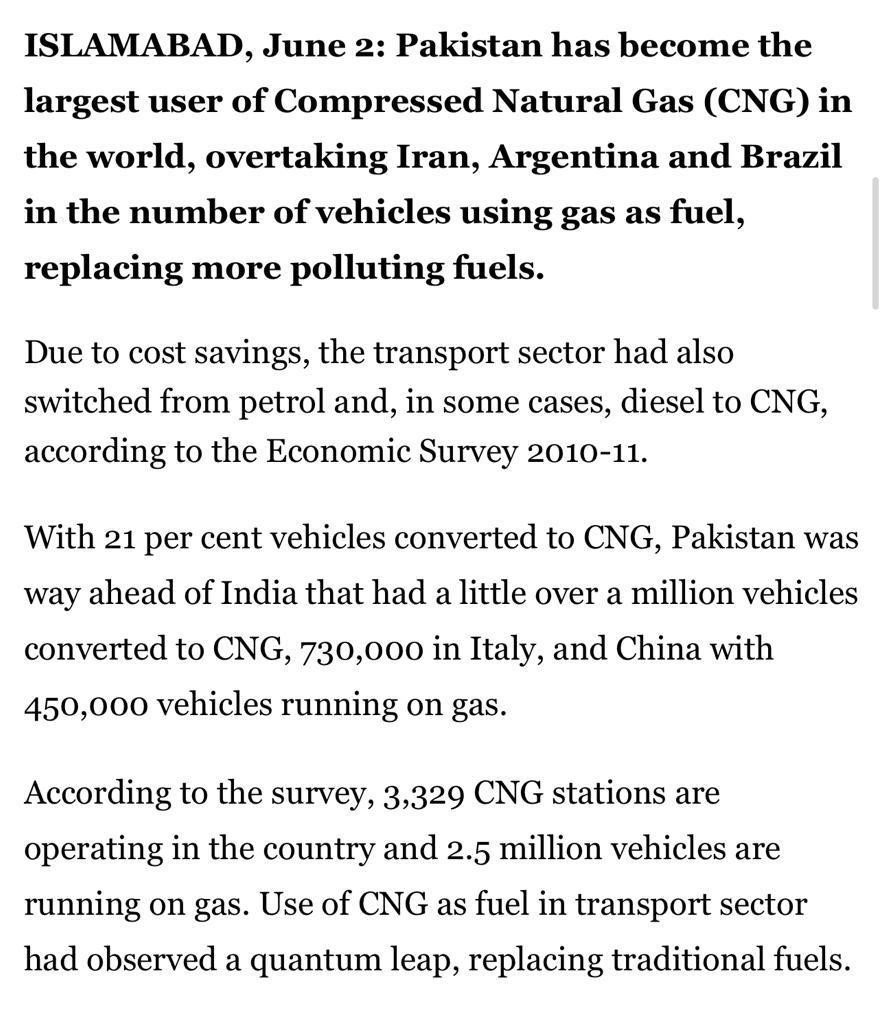
Appendix 3 is a news clip from a 2nd June 2011 article, proudly mentioning Pakistan as the largest CNG user country in the world.
